
Report Distribution in ServiceNow

The purpose behind writing this blog is to showcase the functioning of reports distribution in ServiceNow. This blog will give the basic understanding of creating and dispensing reports.
Reporting:
- Reporting enables to create and distribute reports that show the current state of instance data, such as the number of open incidents of each priority.
- Reporting functionality is available by default for all tables, except for system tables (e.g. sys_audit, syslog, sys_attachment, sys_email, etc).
- ServiceNow platform has various ways to share/distribute reports. One can either save as well as export a report in several static file format (like pdf, JPEG, PNG, excel), publish a report through public URL, schedule a report to send it automatically by email, create Gauges and add them to Homepages.
For Report Distribution:
- Reports can be exported in PDF format.
- Depending on Logged-in user’s role, reports from the List can be exported in Excel, CSV or XML formats.
- Graphic/Non-List reports can be saved in PNG or JPEG format.
The data in the background constantly changes. Saving and exporting reports are generally not good practice for sharing Dynamic reports as the saved and exported reports are static.
But sometimes the static reports are required.
For example : To get a report in PNG format:
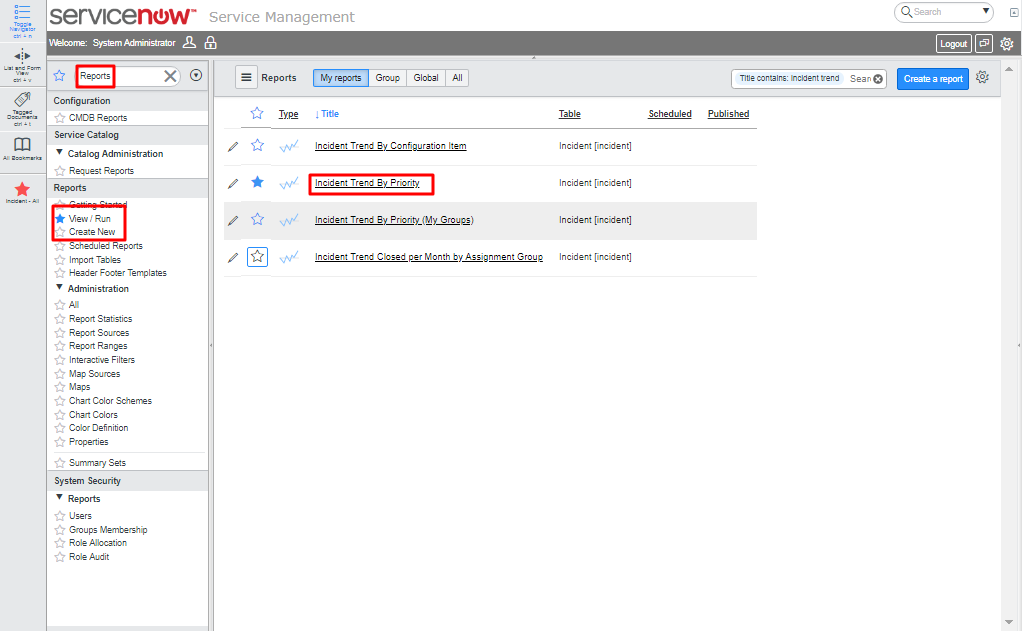
- Navigate to Reports -> View/Run and select an existing report from the list or create own report by navigating to Reports -> Create New.
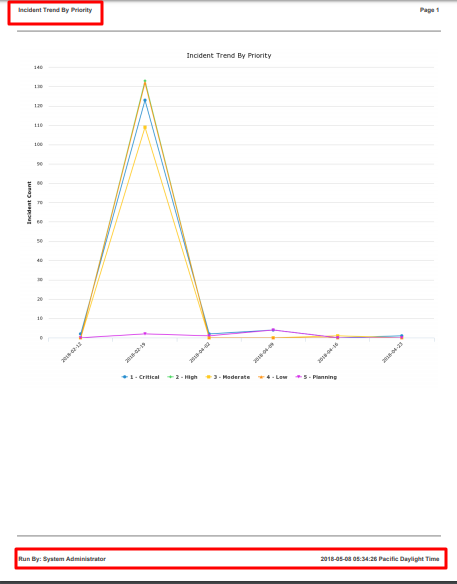
- Select a report (for demonstration, ‘Incident Trend by Priority’ is selected here).
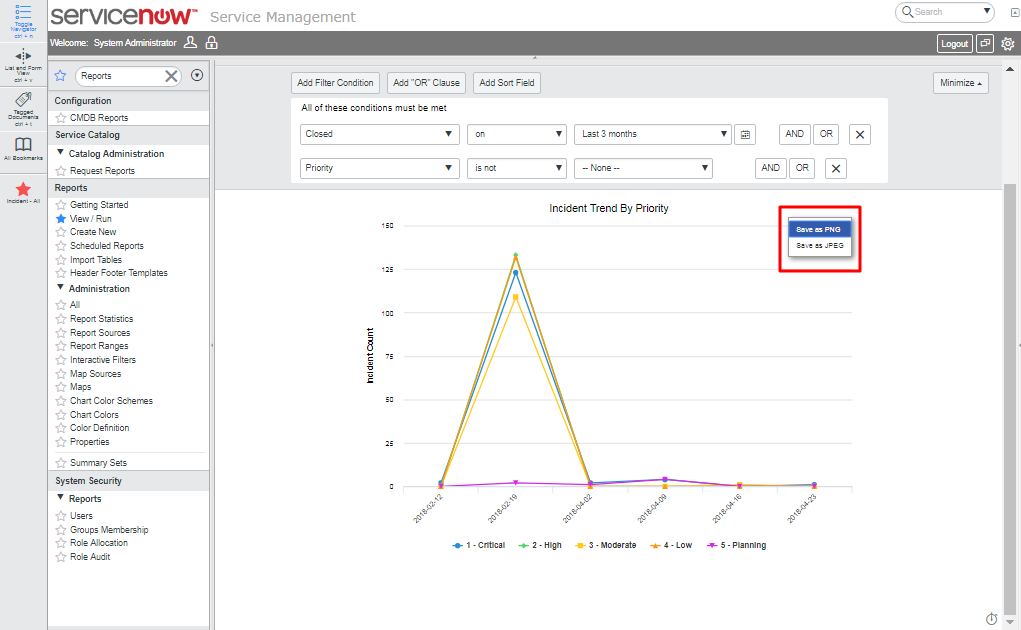
- Save the Report as a PNG file and download it.
- After downloading, the generated report will look like the following :
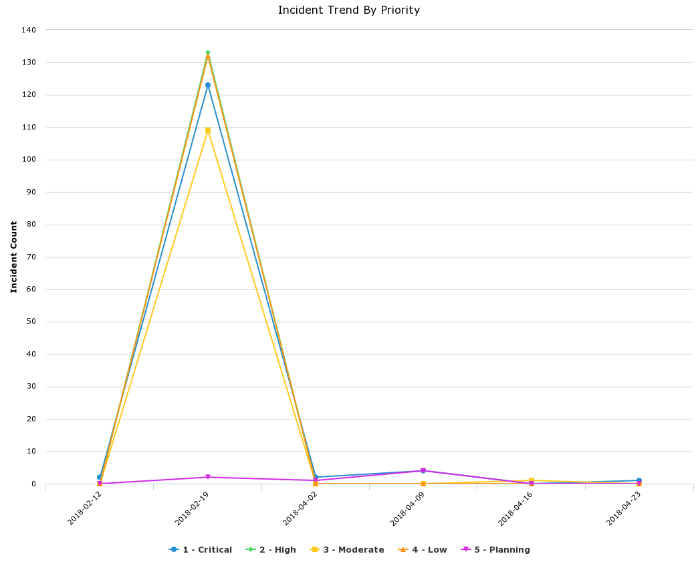
- Notice that the downloaded report does not have any header and footer. One can add header and footer from export settings :
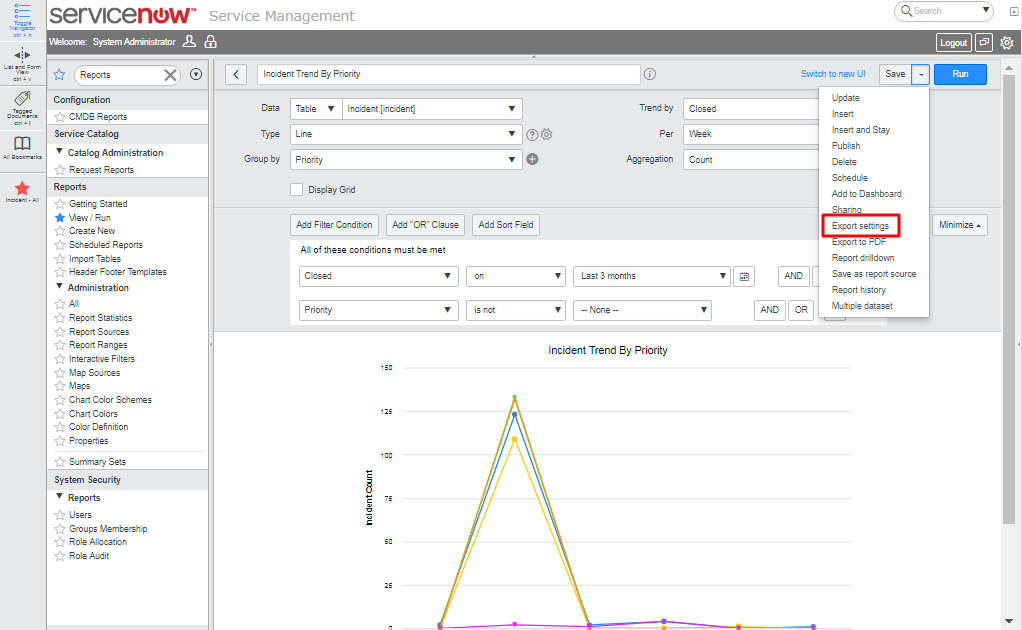
- To export the report in PDF file format, click on triangle icon after the ‘Save’ button and select ‘export to PDF’. One can specify the orientation (Landscape, Portrait) and delivery methods (Generate now, Send as an email).The generated report in PDF format will have header and footer by default.
Now, let’s look at List Reports:
- Navigate to Reports -> View/Run and then open an existing/saved report.
- For demonstration, ‘Active Incidents Assigned To Software Group’ is selected.There are various export options for the List reports: List, CSV, PDF, as shown in the screenshot.
The PDF option includes orientation (Landscape & portrait) and the Detailed Portrait and Detailed Landscape. The detailed options export the list as well as the associated form for each record in the list.These choices work the same in list reports as they do in graphic non-list reports.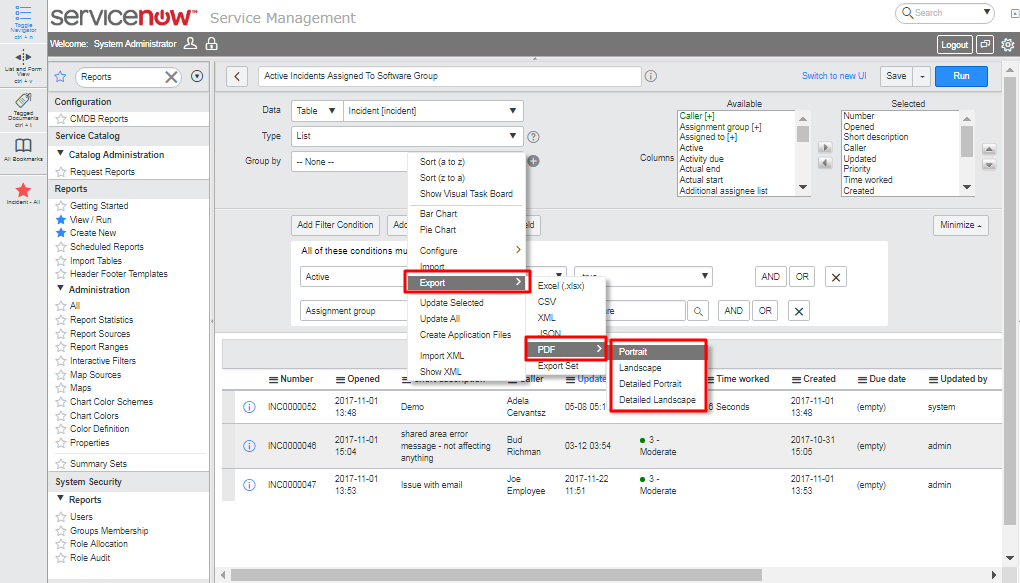
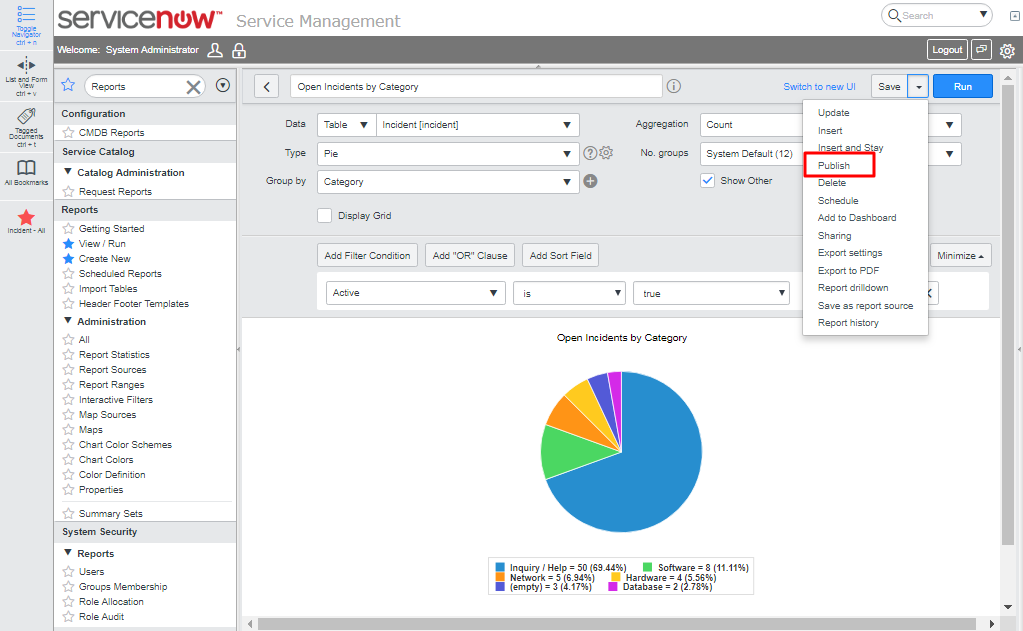
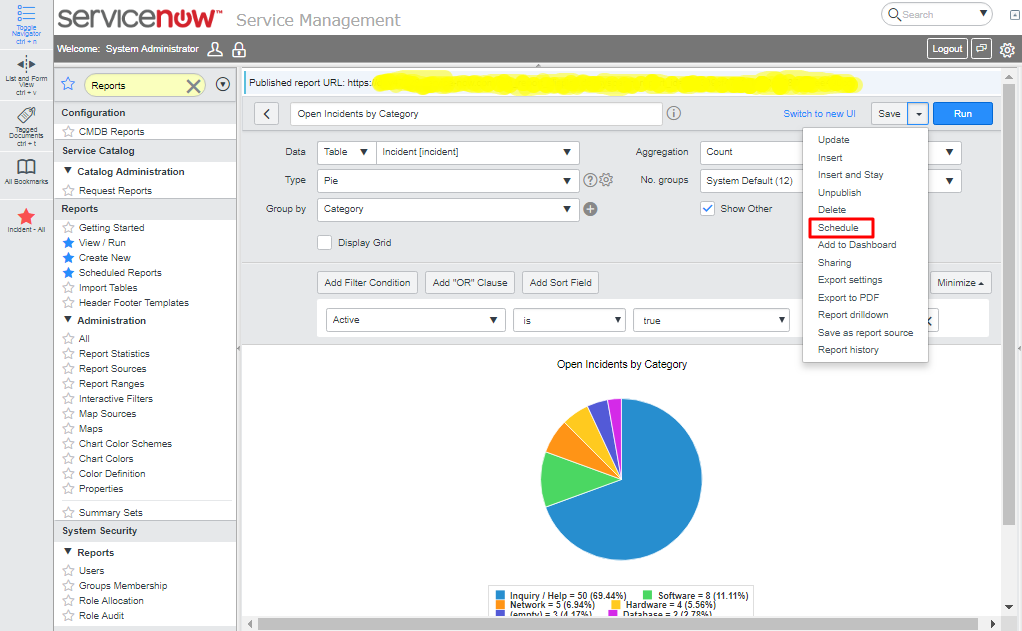
- The important point to remember here is the limits to the amount of data that can be exported at one time. The ServiceNow platform has provided default limits to the amount of data that can be exported at a time. Different formats have different export limits.A good practice for sharing a ServiceNow report is to publish it to a publicly accessible URL and schedule distribution of the URL by email for delivery at specific times of the day, week or month, internally or externally.To publish reports, the logged in user must have both the ITIL and report_publisher role.Let’s say one wants to publish the ‘Open Incidents by Category’ report to share it.
Open the report and click on triangle icon next to the ‘Save’ button and select the ‘Publish’ option as shown below:
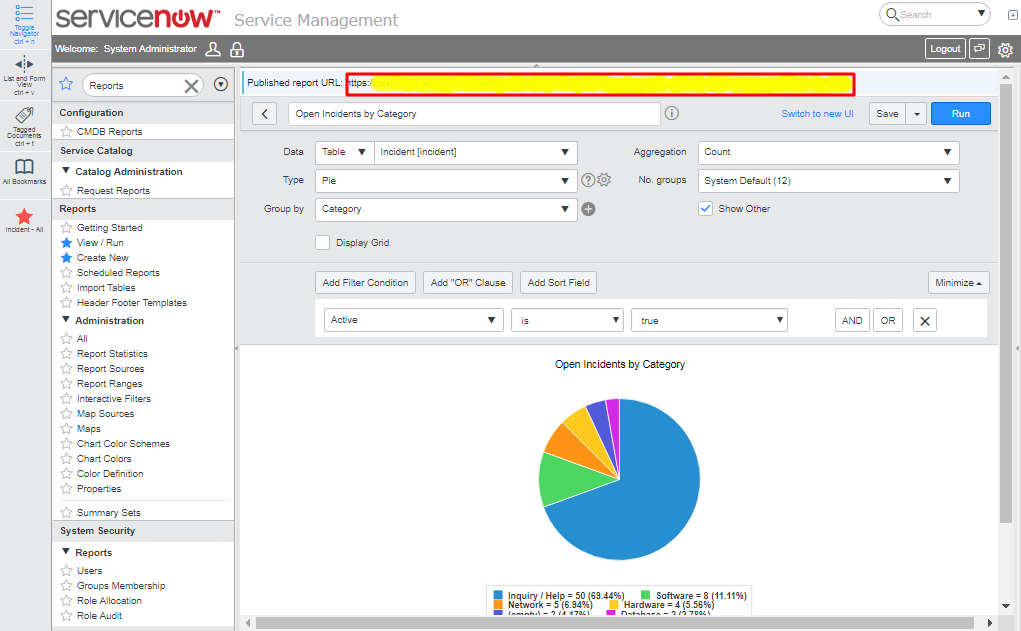
After publishing the report, the report URL appears at the top of the form. One can copy it to embed web pages or email notifications:

When user clicks the URL link, the webpage always displays the report based on current data.
But users can’t view the underlying data unless they are logged in to the ServiceNow instance and have access to do so.
Refreshing the browser updates the report with the latest data in the underlying table.
The published report can be unpublished by selecting the ‘Unpublish’ option.
Automating the Report Distribution:
Scheduling is an appropriate way to automate the distribution of reports.
It allows you:
- To run large reports during off hours.
- Generate reports of data at regular interval.
- Distribute reports to internal groups or individuals in the system – or even externally.
To schedule report, the logged-in user must have report_scheduler or report_admin role.
Example: Automating distribution by Scheduling the ‘Open Incidents by Category’ report.
- Navigate to Reports -> View/Run, Open any report for scheduling and copy the published URL.
- Open the scheduling form by clicking at triangle icon next to the ‘save’ button and select the ‘schedule’ option from the list.
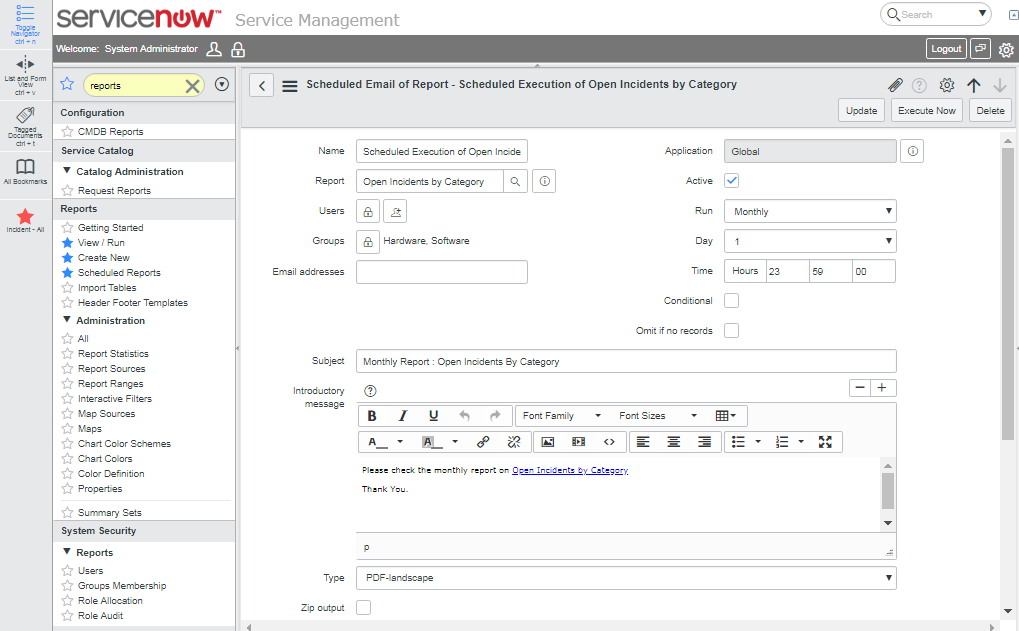
- Fill the form, select the users or/and groups to whom the report should be sent through email notification.
- The users/Groups on the schedule report form are the internal users.
To send scheduled report to external users, one can add the comma separated email addresses in the ‘Email Addresses’ field.To receive scheduled reports, users must have an email address defined and have email notification enabled in their user record.If the report to be scheduled is very large, one can zip it by using Zip ‘Output field’ checked. - Select the frequency when one wants the report to be sent, Yearly, Monthly, Weekly Daily, etc. then select the day and the time to send the report.
- Provide a Subject and a Message.
- One can send additional scheduled report within the same email notification by selecting another report through ‘Include with’ field.
After submitting, the report is scheduled and the system will generate email notifications at the specified time. All the Scheduled reports can be viewed from ‘Scheduled Reports’ module.
Report Sharing through ‘Gauge’:
A Gauge is a refreshable widget viewable as a Homepage section.
Any report can be a Gauge but not all Gauges are reports.
Example:
To create a Gauge and add it to the ITIL Homepage:
- Navigate to Reports -> View/Run then open any existing report.
- Select down arrow at the side of save button and select the ‘Make Gauge’ option.
- If the Gauge already exists for that report, the ‘Make Gauge’ option does not appear in the option list.
- Navigate to ‘Edit ITIL Homepage’ by logging in as an admin user and click on ‘Add Content’.

- Select the Gauges from the first list, then select the table from middle list and select the report to be added as a Gauge, in the third list.
- Put the Gauge at the position according to relevance.
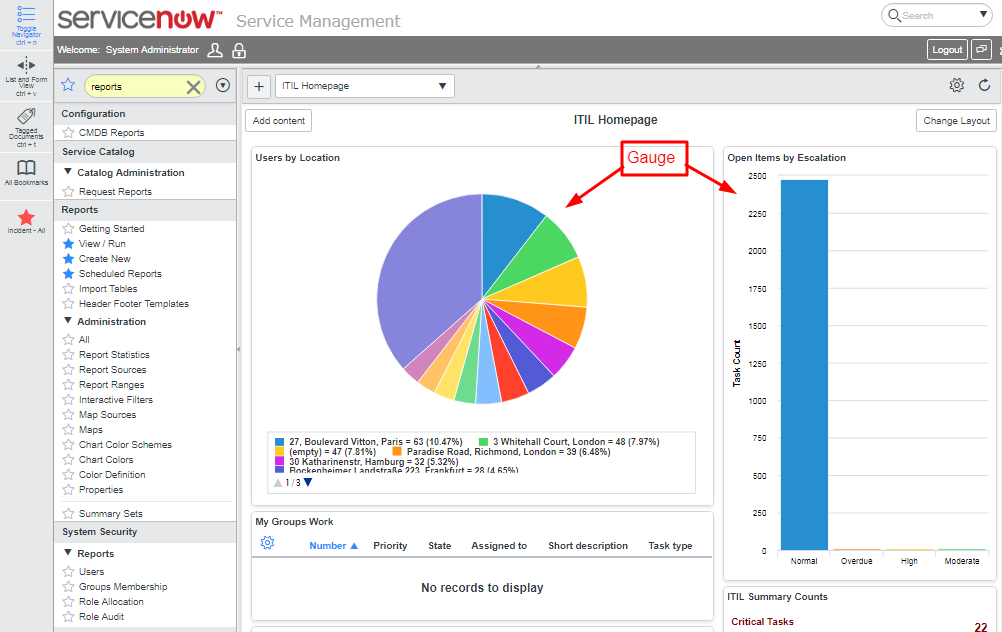
- The ITIL user can interact with this Gauge, just as with the original report.
- These Gauges on Homepage are refreshed according to the refresh settings.
- The system refreshes all Gauges on the Homepage each time the Homepage is displayed for a user.
- Each refresh requires a database query. These database queries fetch the current status of the records in the specified table.
- Users should avoid frequent refreshes, if many users are viewing the homepage, it may cause performance issues.
We hope this blog must have given you an insight on Report Distribution in ServiceNow. We will appreciate any suggestion/feedback on the same.