Introduction to Performance Analytics in ServiceNow and its features

Introduction:-
Performance Analytics comes with over 350 default KPIs to measure platform processes. It includes mobile-enabled
scorecards, interactive dashboards, and authoritative analytics. It enables you to track, aggregate, and visualize
key performance indicators over time.
Performance Analytics modules includes Indicators, Breakdowns, Indicator Source, Breakdown Source, Data Collection
Jobs, Scorecards, Scoresheet, Indicator Groups, Target, Threshold, Text Analytics, Dashboard, Widgets.
-
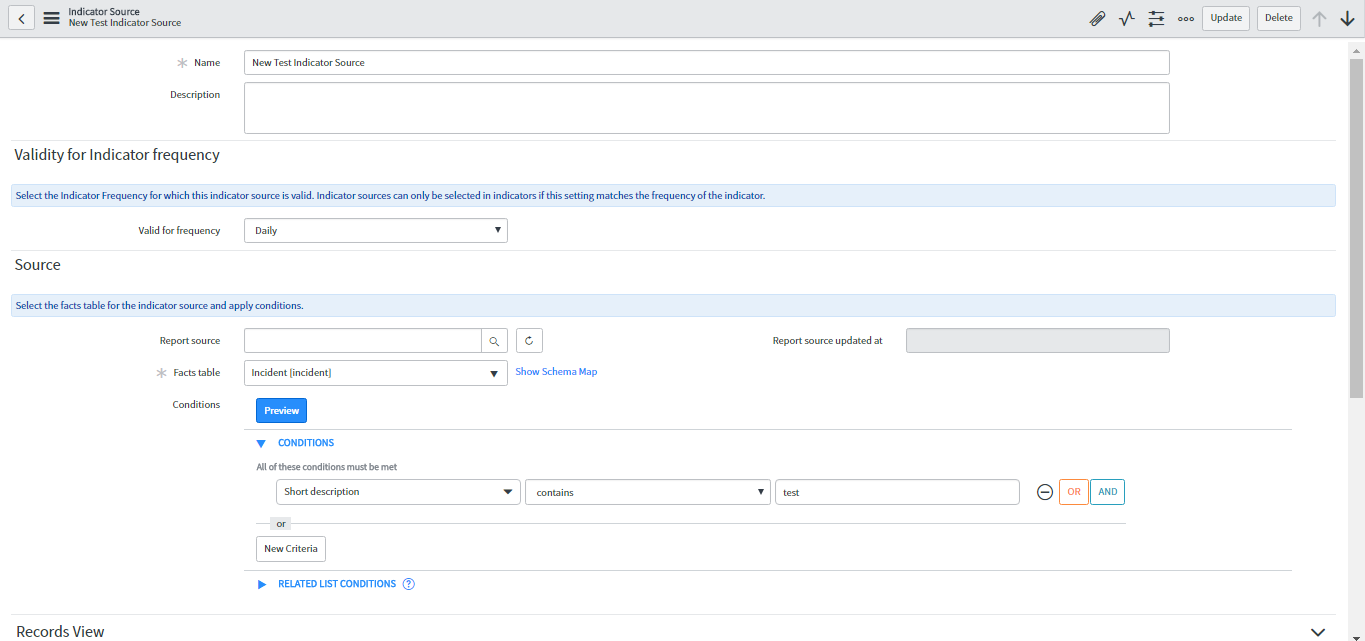
Indicator Source:-
- Indicator Source can only be selected in Indicators.
- In Indicator Source, select the indicator frequency for which the indicator source is valid. One can
select frequency as a daily, weekly, monthly, early etc. - Select the fact table in source and apply the conditions.
- The records view should be default for Portal, Mobile, Self-Service, and Major Incidents.
- Fill all fields and save the record.
-
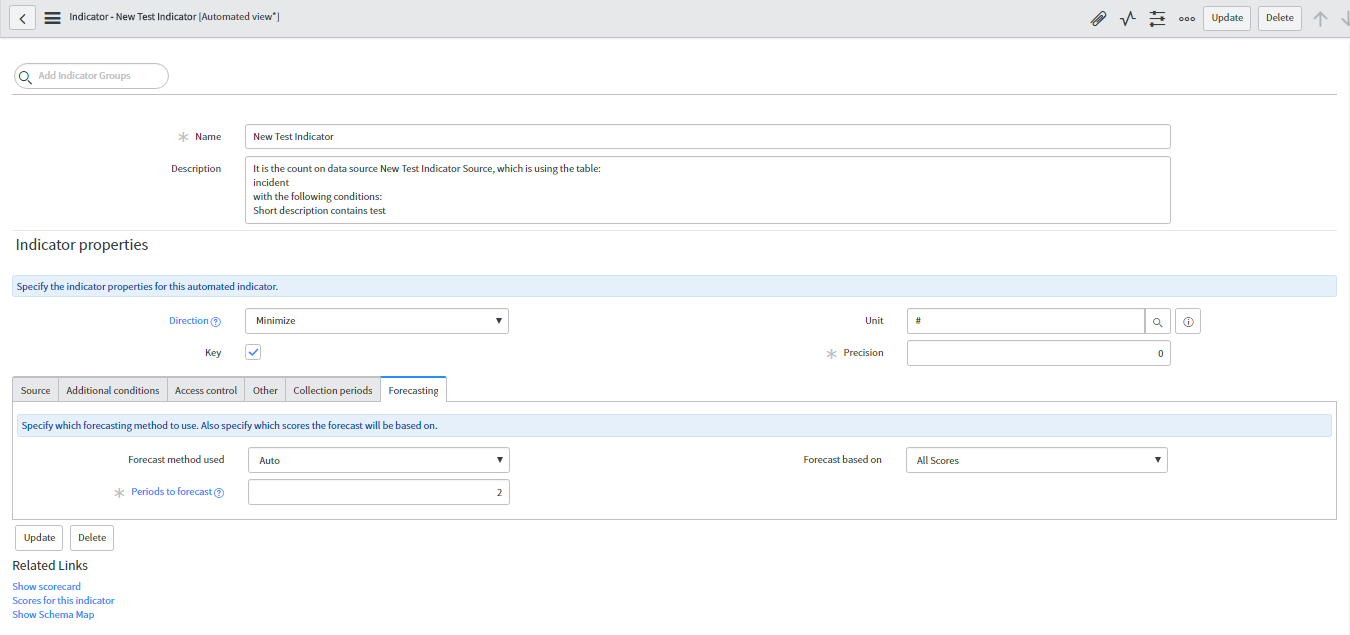
Indicator:-
- It is a metric that serve to measure current conditions and forecast business trends.
- In indicator’s, ‘Direction’ should be minimized or maximized.
- The ‘Units’ can be integer, number, currencies, quantities of time etc.
- In ‘Precision’, select the number of decimal digits to be displayed in the scores of
the indicators. - Specify access control for this indicator. If ‘Publish on scorecards’ is unchecked,
this indicator will not be available in Scorecards. If this indicator is not accessible for all roles,
then specify the roles that have access to this indicator. - There are 3 Types of Indicators-
- Automated Indicators
- Manual Indicators
- Formula Indicators
-
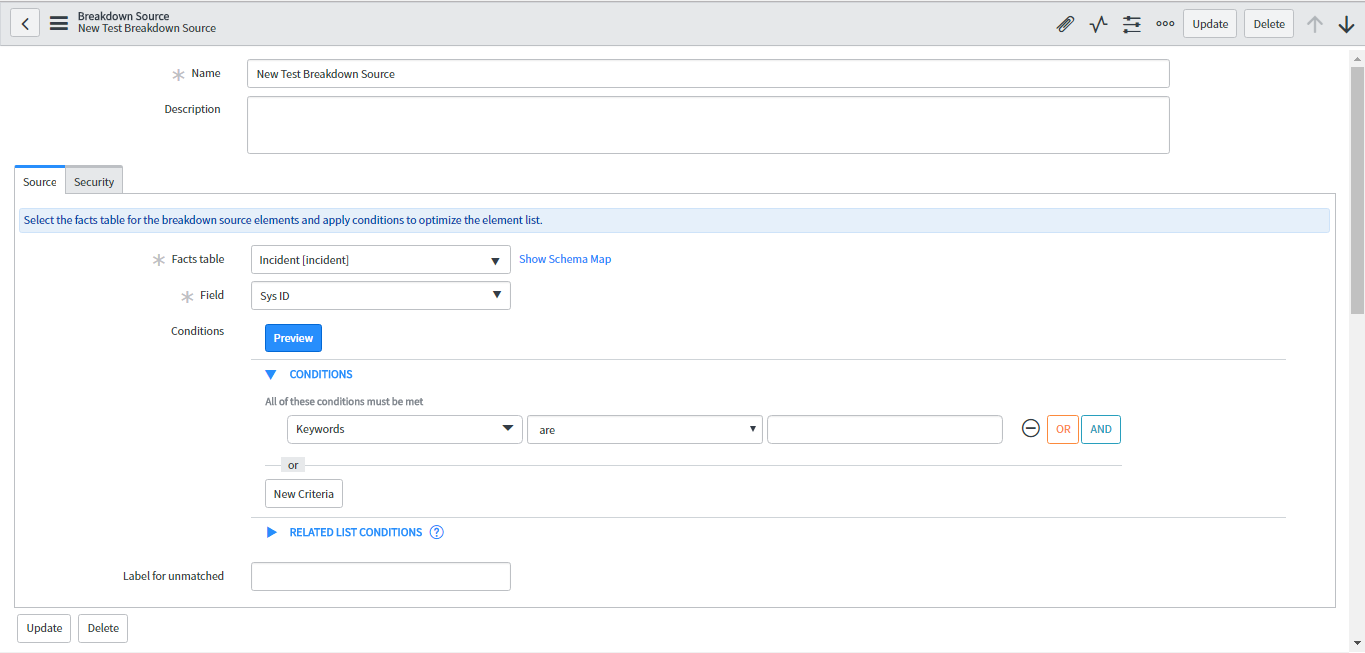
Breakdown Sources:-
- Breakdown specify what unique elements a breakdown contain.
- Breakdown Source includes set of records from table or database view or as a bucket group.
- Select the fact table in breakdown source and apply the conditions.
-
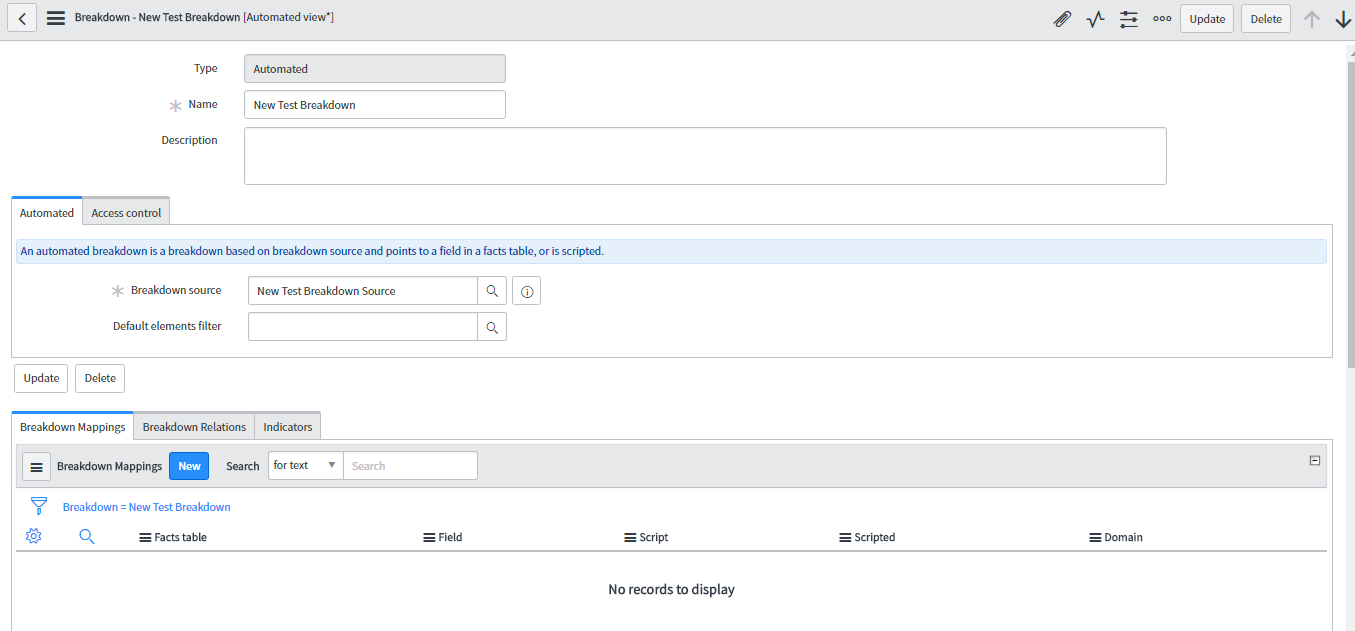
Breakdown :-
- Breakdown is based on breakdown source and points to a field in facts table or is scripted.
- In Breakdown, one can specify access control.
-
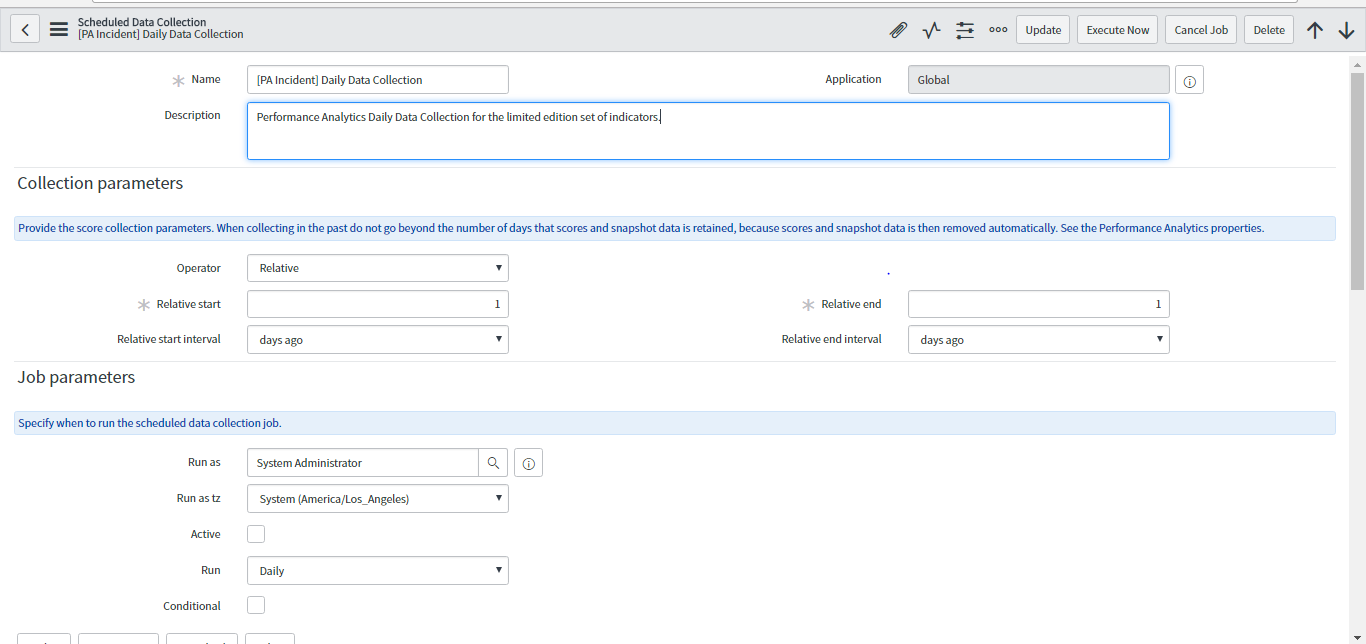
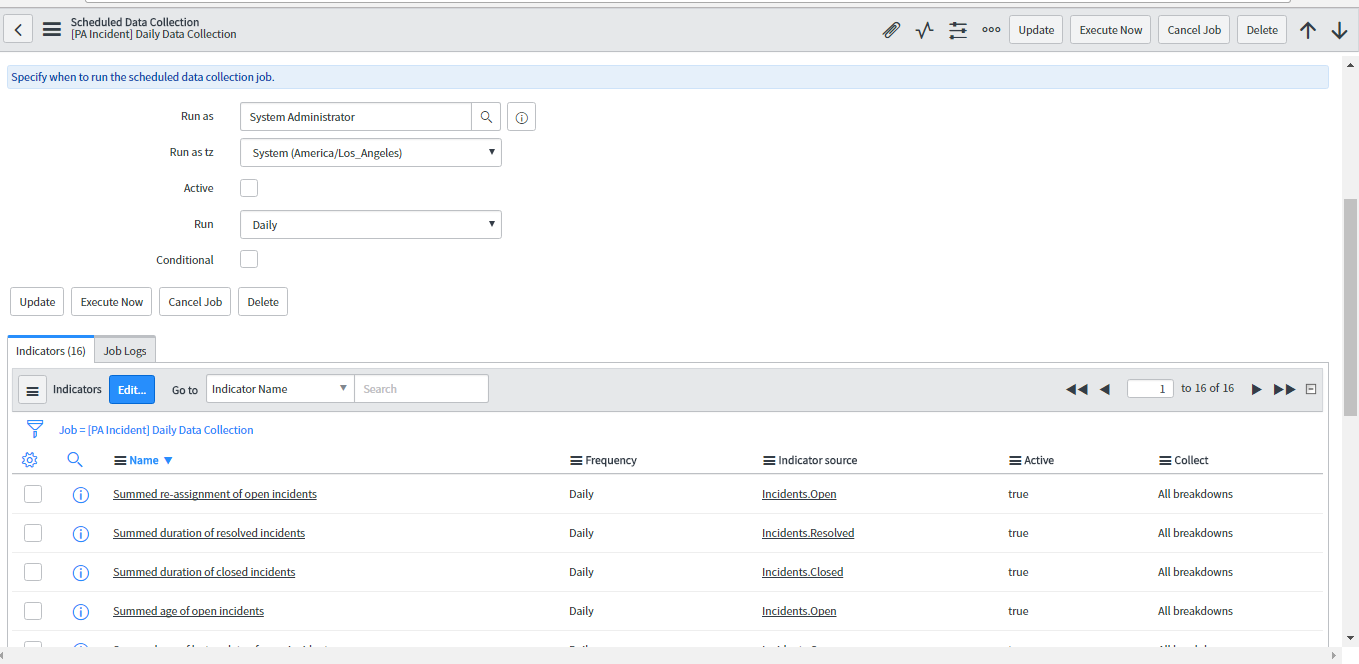
Data Collector :-
- By running jobs, Data Collector collects scores from the database regularly.
- Data collector connects to the ServiceNow database directly to send the data to Performance Analytics on
daily basis. - Before executing data collector jobs, make sure that indicator sources, breakdown sources, and
indicators have been defined. Otherwise, jobs cannot return any results.
-
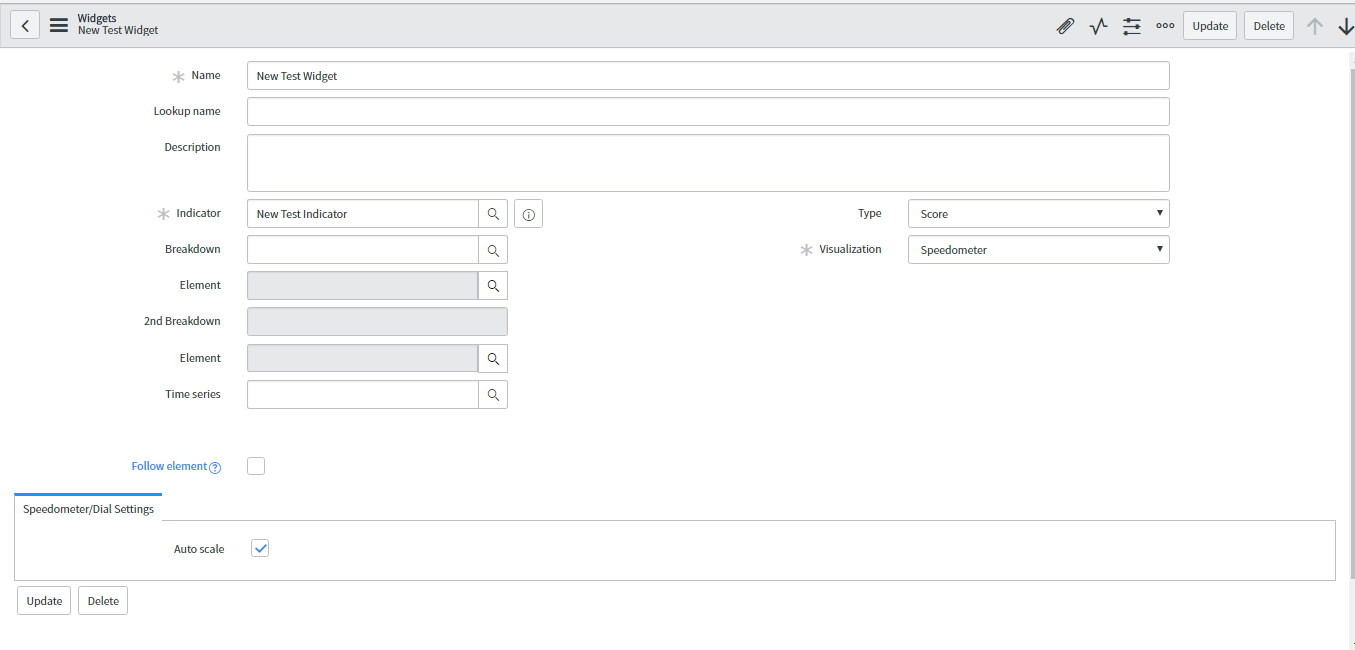
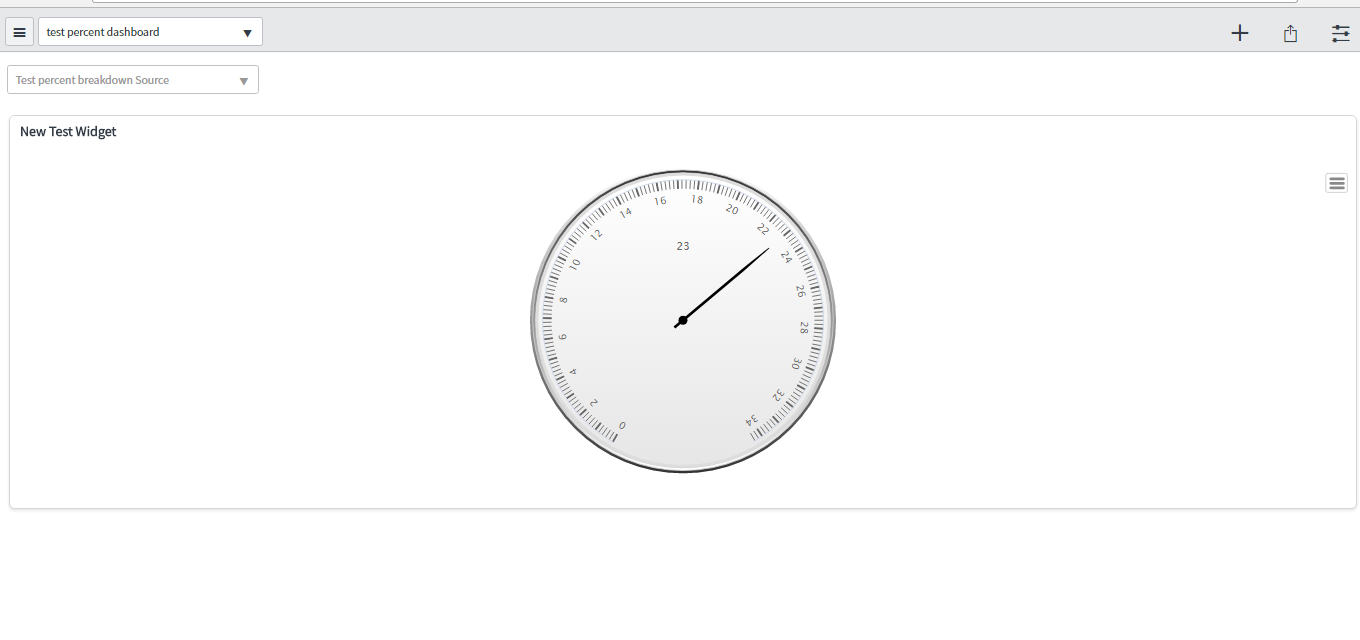
Widget :-
- To view, set-up, revise and manage properties for dashboards and visualization types, Widget
configuration can be used. - Widgets are available on dashboard.
- Types of Widget :-
- Time series widget
- Breakdown Widget
- Score Widget
- List Widget
- Pivot Widget
- Text Analytics
- Workbench Widget
- To view, set-up, revise and manage properties for dashboards and visualization types, Widget
-
Dashboard :-
- Multiple tabs can co-exist on a dashboard. One or more widgets can be held on each tab.
- Dashboard is used as canvas where one can display their reports, PA widgets and other ServiceNow
elements. - Dashboard is only available to users with the pa_admin and pa_power roles assigned.
These users have authority to set up and edit the dashboard. - Dashboard content can be organized with the help of tabs and widgets.
- Dashboard can be Responsive or Irresponsive.
-
Text Analytics :
- Text analytics select the text field to analyze and which indicator to analyze.
- Text analytics is a word cloud.
-
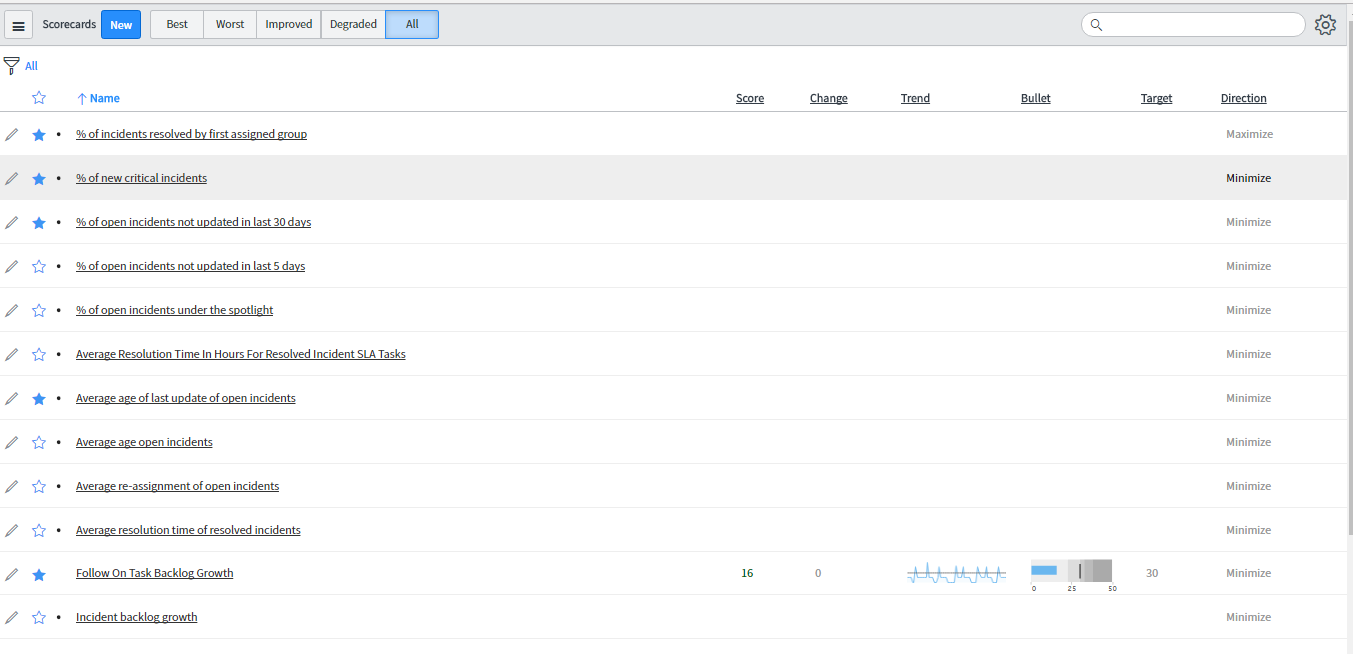
Scorecards:-
- Scorecards display a list of collected scores by date, and the formula values for formula indicators.
- Scorecard only displays data for single indicators.